The concept of liquidity refers to the ease with which an asset can be bought or sold. When there is a lot of demand for an asset, it is said to have high liquidity and can be easily traded. When there is low demand for an asset, it is said to have low liquidity and can be difficult to trade.
Liquidity flowing from one asset to another can be a sign of market sentiment and can provide valuable information to traders. By understanding how liquidity is moving, traders can gain insight into where the market is heading and make informed trading decisions.
How to Read Volume Flow Chart?

- To access the Volume Flow page, simply visit the website at https://www.cryptometer.io/volume-flow.
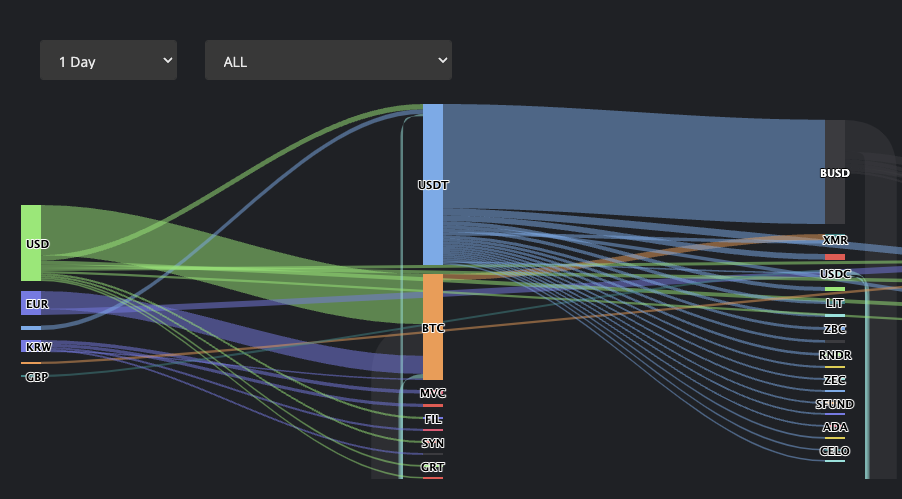
- Understanding the Flow Graph: Upon landing on the page, you will see a flow diagram that displays the flow of liquidity between different cryptocurrencies. Each node represents a cryptocurrency, and the width of each flow arrow represents the volume of liquidity moving from one cryptocurrency to another.
- Selecting Different Timeframes: You can also select different timeframes to view the liquidity flow data for different periods. This is useful if you want to see how the liquidity flow has changed over time, and how it has been affected by different events and market conditions.
- Analyzing Volume Flow: To analyze the volume flow between specific cryptocurrencies, simply hover over the flow arrows in the flow diagram. This will display the volume of liquidity moving from one cryptocurrency to another. By analyzing the volume flow between different cryptocurrencies, you can gain insight into the liquidity relationships between different assets.
- Understanding Net Inflow/ OutFlow: A positive net inflow indicates that there is more buying activity for that cryptocurrency, while a net outflow indicates that there is more selling activity.
- Benefits of Knowing Liquidity Flow: Understanding the liquidity flow between different assets can provide valuable insights for traders. For example, it can help you identify potential opportunities by showing you which cryptocurrencies are experiencing high liquidity and which ones are struggling. It can also help you avoid potential risks by showing you which cryptocurrencies are being sold off and which ones are being bought up.
When Demand Increases
If liquidity is flowing into an asset, it means that there is increased demand for the asset and traders are buying it. This increased demand can lead to several consequences:
- Price increase: When demand for an asset increases, its price tends to go up. This is because more people are willing to pay higher prices to own the asset.
- As demand for an asset increases, the volume of trades in that asset also tends to go up. This can provide further evidence of the increased demand and support the price increase.
- When liquidity flows into an asset, it can lead to increased market activity. This can include an increase in the number of trades, the introduction of new investors, and an increase in the volume of information and news about the asset.
- Increased demand for an asset can also lead to an improvement in market liquidity. This means that it becomes easier to buy and sell the asset without affecting its price, making it more attractive to traders.
It’s worth noting that the effects of increased liquidity in an asset can be temporary. If the underlying factors that are driving the demand for the asset change, the flow of liquidity can reverse, leading to a decrease in demand and a corresponding drop in the price of the asset.
Therefore, traders should carefully consider the factors that are driving the demand for an asset and use technical analysis and other tools to identify trends in the flow of liquidity before making decisions.
AI Filter
Our AI Money Flow Tracker quickly analyzes more than 5,000 cryptocurrencies, pinpointing the ones getting significant money inflows—often a sign they might increase in value. It tracks capital movements in real time, cutting down on unnecessary information and helping you spot investment opportunities more efficiently.
With our AI Filter, you can easily find the most promising trading opportunities across thousands of cryptocurrencies. This saves you time and improves your trading strategy.
I hope this tutorial was helpful in getting you started with using Cryptometer.io/volume-flow. If you have any additional questions or need further assistance, please contact support.
