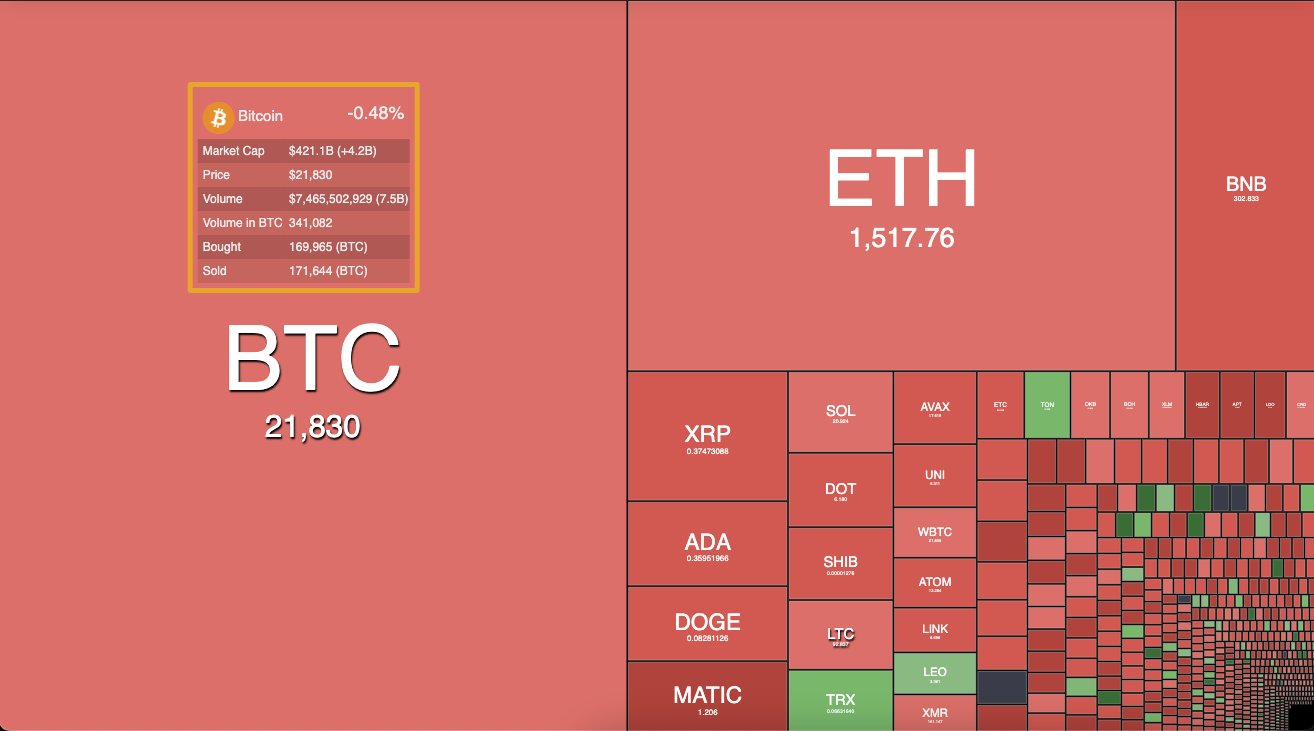
A heatmap is a graphical representation of data that uses colors to show differences and similarities in values. In the context of financial markets, a heat map is often used to visualize changes in market capitalization, price, volume, and other key indicators for a group of assets. At cryptometer.io/heatmap, the heatmap displays information on market cap, price, volume in USD, volume in bitcoin, total buy volume, and total sell volume.
Reading the heatmap:
The heatmap at Cryptometer.io is easy to read and understand. The assets are represented by colored blocks that are either green or red. Green represents an asset that is in positive change, while red represents an asset that has dropped significantly. The intensity of the color indicates the degree of change, with a brighter color indicating a larger change.
On the heat map, you can quickly see which assets are performing well and which are not. You can also compare the performance of different assets and see how they are related to each other. For example, if you see a group of assets that are all green, it may indicate that the market is bullish, while a group of assets that are all red may indicate that the market is bearish.
Benefits of using a heatmap:
- Quick and easy to understand: Heatmaps are an effective way to quickly grasp the changes in the market without having to analyze complicated data. This makes it ideal for traders who are short on time and need to make quick decisions.
- Visual representation of data: Heatmaps provide a visual representation of data that can help traders identify patterns and trends that they may not have noticed otherwise. This can be useful in making informed trading decisions.
- Multiple data points: Heatmaps can display multiple data points, making it possible to view changes in market capitalization, price, volume, and other key indicators in one place.
The heatmap at Cryptometer.io is a useful tool for traders who are looking to keep up-to-date with changes in the market. With its quick and easy-to-understand visual representation of data, traders can stay informed and make informed decisions with ease.
