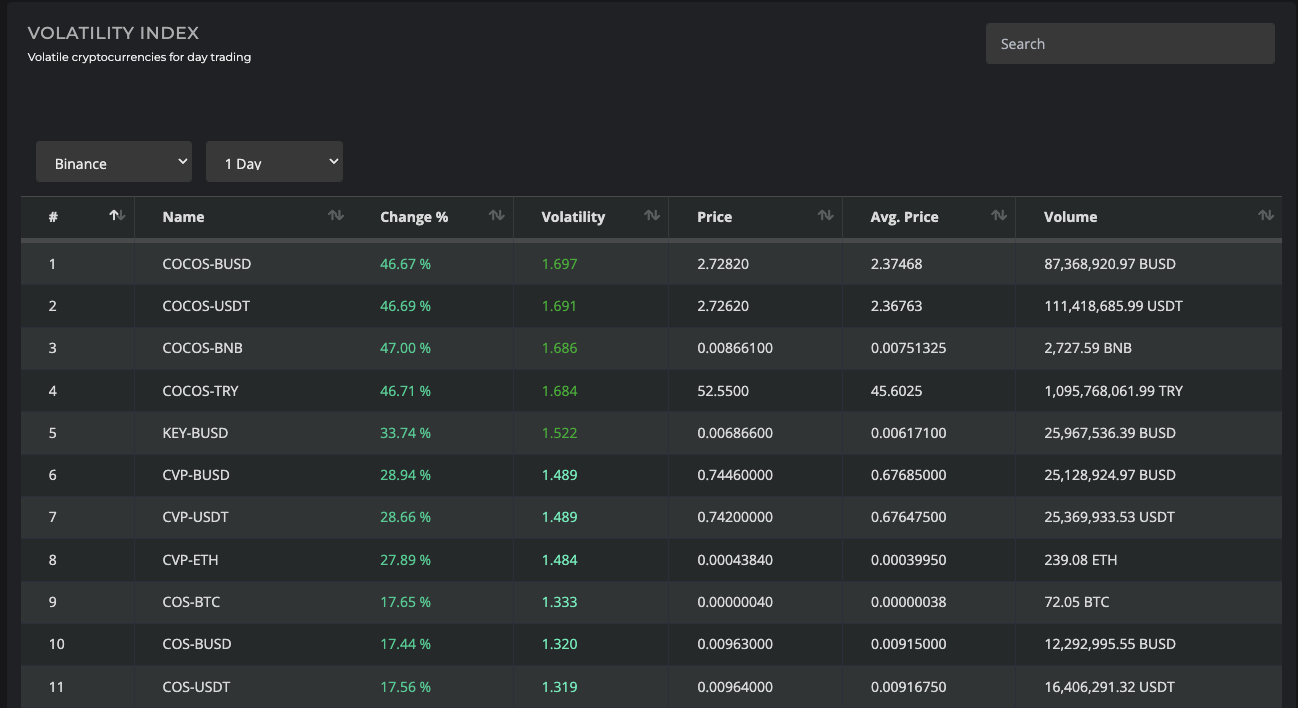
Cryptocurrency volatility is an important factor in day trading. The higher the volatility, the greater the potential for profit, but also the risk of loss. Cryptometer.io/Volatility is a powerful tool that can help you analyze the volatility of various cryptocurrencies, providing you with insights that can guide your trading decisions.
In this tutorial, we will provide an overview of the Cryptometer.io/Volatility tool and explain how to use it to analyze cryptocurrency volatility.
Accessing Cryptometer.io/Volatility tool
To access the Cryptometer.io/Volatility tool, go to the volatility index. The tool provides a table view with the following columns:
- Name: The name of the cryptocurrency
- Change%: The percentage change in price over the selected timeframe
- Volatility: The volatility score of the cryptocurrency
- Price: The current price of the cryptocurrency
- Average Price: The average price of the cryptocurrency over the selected timeframe
- Volume: The trading volume of the cryptocurrency over the selected timeframe
Selecting the Exchange and Timeframe
To begin analyzing cryptocurrency volatility, select the exchange and timeframe from the dropdown menus. The exchange dropdown provides a list of popular cryptocurrency exchanges, including Binance, Bitfinex, and Coinbase. The timeframe dropdown provides options for 1 day, 4 hours, 1 hour, 30 minutes, 15 minutes, and 5 minutes.
Volatility Score
The volatility score is an important metric provided by the Volatility Tool. The volatility score is calculated using a proprietary algorithm that takes into account various factors, including the price movements and trading volume of the cryptocurrency.
The volatility score is displayed in the Volatility column of the table. The score ranges from 1 to 5, with 1 being considered neutral, above 1 to below 1.5 being considered moderate, and above 1.5 being considered high volatility.
Analyzing Other Metrics
In addition to the volatility score, the Cryptometer.io/Volatility tool provides other metrics that can be useful for day traders. The Change% column shows the percentage change in price over the selected timeframe, which can indicate the short-term trend of the cryptocurrency. The Price column shows the current price of the cryptocurrency, which can be compared to the Average Price column to identify whether the cryptocurrency is currently overvalued or undervalued.
The Volume column shows the trading volume of the cryptocurrency over the selected timeframe, which can indicate the liquidity of the cryptocurrency. Higher trading volume can provide more opportunities for trading and reduce the risk of illiquid markets.
The Cryptometer.io/Volatility tool provides a comprehensive view of cryptocurrency volatility, with a proprietary algorithm that calculates the volatility score. The tool can be used to identify the most volatile cryptocurrencies, as well as to analyze other metrics such as price change, current price, average price, and trading volume. By using this tool, day traders can make more informed trading decisions, reducing their risk and maximizing their potential for profit.
